Top 20 Companies: Synergistic Acquisitions Pay Off
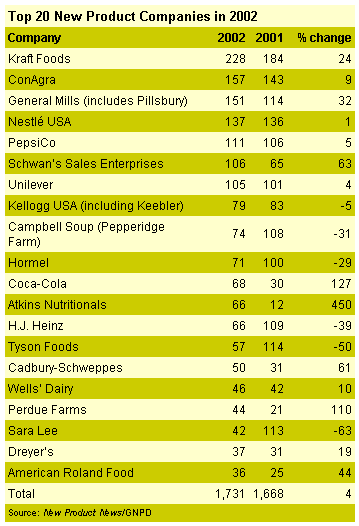
After perhaps a rocky start for both companies, Kraft and General Mills both have shown very significant growth in their new product introductions in the last year. Kraft, almost as always, led the list with 228 new products in 2002, up 24% from the prior year (that prior year also included the Nabisco purchase). General Mills had fewer new products (151), but also showed significant growth from the prior year. Those 2002 figures were up 32% from 2001's figure of 114 products. Coca-Cola, Atlanta, doubled its product offerings in 2002, partially because of its Odwalla, Half Moon Bay, Calif., purchase.
However, the news is not always quite so positive. Looking more closely at the Top 20 companies, we see that Tyson, Springdale, Ark., in terms of new product introductions, has not benefited so well with its new acquisitions; its ranking fell substantially. Tyson introduced half the number of products in 2002 (57) that it did in 2001. Less severe is Kellogg, Battle Creek, Mich. While Kellogg (combined with Keebler, Elmhurst, Ill.) did not experience the drop that Tyson did, its introductions were essentially flat in 2002 compared to 2001 (79 compared to 83).

Overall, the total number of products introduced by the Top 20 was 1,731, up 3.2% from the Top 20 companies in 2001. That is a significant figure, as the total number of new food product introductions actually was down a very slight 0.5%. As a result, we see the total percentage of all food products—coming from the 20 most-active companies—continuing to grow. In the late 1990s, the percentage this group contributed hovered around 12% or so. In 2001, that percentage climbed to 17.4%, and climbed even further to 18.1% in 2002. Those percentage contributions are the highest seen since the late 1980s.
Each year, this list is presented with the same caveats. Although raw numbers of new product introductions are no measure of an organization's success or failure rate, it is instructive to see which companies consistently invest their assets in new product development and marketing, which are innovation laggards, and which change overall new product strategies from year to year. Also, it should be noted that this study defines a new product as a new food or beverage featuring changes or introductions of flavors, colors, or varieties. However, changes in size or packaging, as well as product improvements, are not represented.
Looking for a reprint of this article?
From high-res PDFs to custom plaques, order your copy today!

