Comax Flavors: Consumer Bread Behaviors
Comax Flavors shares consumer insights regarding breads
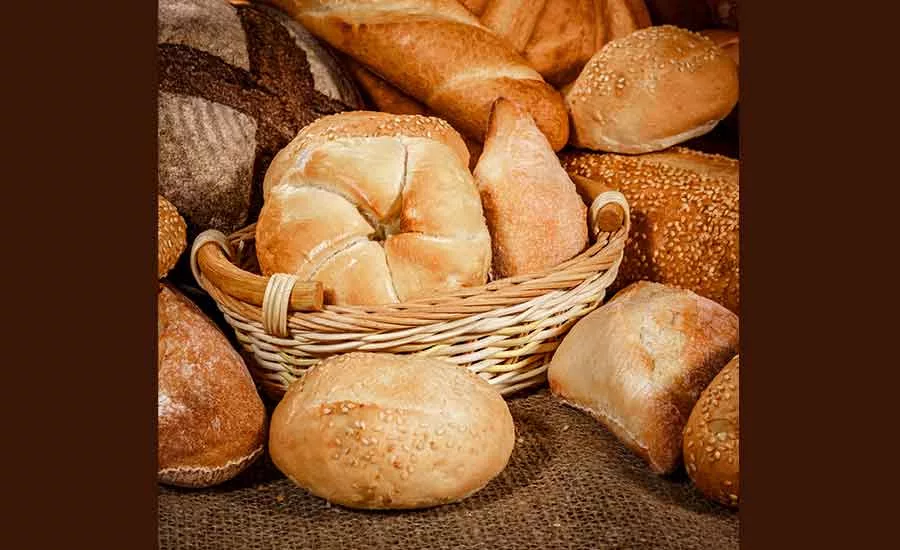
Comax Flavors has released new primary research on consumers’ behavior, usage and attitudes towards bread products. Specifically, its findings explore attitudes and usage involving sliced bread, English muffins, bagels, pitas and wraps/flatbreads.
This is the eighth study of the company’s primary market research program. The Bread study was fielded in September 2017 with 1,000 U.S. respondents aged 18-70+; half were female and the other half were male.
Bread is a staple of the US diet but consumers are eating it less frequently and in smaller quantities. According to IRI data for 52 weeks, ending June 11, 2017, there was little change in the overall bakery sector, with a mere 0.1% rise to $13.31 billion from the year prior.
“We recognize that the bread market is stagnant. Consumers are gravitating towards low-calorie, whole grains, artisanal and gluten-free breads and we wanted to better understand what’s happening among the general population,” notes Catherine Armstrong, Comax Flavors vice president of corporate communications.
Armstrong says Comax partnered with Amy Marks-McGee and Trendincite LLC to manage the market research program; and Costello Creative Group to translate the data into creative, fun and easy-to-read infographics. Additional Comax studies include those involving crackers as well as spirits.
Below are just a few of the study highlights. To request a copy of the complete “Knead Bread”infographic, contact carmstrong@comaxflavors.com.
Sliced Bread Findings - Among respondents who consume “Sliced Bread” N=200:
• “Price” is the most important attribute driving Sliced Bread purchases with two-thirds of respondents citing it
• More than half (57%) of respondents cite “Taste” as the second most important Sliced Bread attribute
• More than three-quarters (85%) of respondents prefer eating a “Closed Sliced Bread” sandwich compared to (16%) who eat it “Open-Faced”
• “Whole Wheat” is the number one flavor consumed by all generations with shy of half citing it (45%)
• 43% of respondents consume “White” bread, making it the second most popular flavor among all generations
• Shy of a quarter of respondents consume “Multigrain” (22%) followed by “Honey Wheat” (19%)
• “Rye” (14%) and “Sourdough” (14%) are equally consumed. Among all generations, the Baby Boomers are the heaviest “Rye” consumers (19%) compared to Gen Y who do not consume “Rye”
• 11% of respondents consume “Italian”
• 9% of respondents consume “Butter”; among all generations, Gen Y (22%) are the heaviest consumers of “Butter” compared to the Silent Generation (3%)
• “Buttermilk” (8%) and “Sourdough” (8%) are equally consumed
English Muffin Findings - Among respondents who consume “English Muffins” N=200:
• “Taste” is the number one driver of English Muffin purchases with 64% of respondents citing it as the most important attribute
• Shy of two-thirds (65%) of respondents prefer eating an “Open-Faced English Muffin” sandwich compared to more than a third (36%) who eat it “Closed”
• “Plain” is consumed by all respondents with more than half (62%) citing it
• More than a quarter of respondents consume “Whole Wheat” (27%) and “Cinnamon” (26%) flavors
• Less than a quarter of respondents consume “Multigrain” (21%)
• 17% of respondents consume “Blueberry”
• 16% of respondents consume” Sourdough”; among all generations, Gen Z is the only generation that does not consume “Sourdough”
• 14% of respondents consume “Honey Wheat”; among all generations, Gen Z (31%) are the heaviest consumers of “Honey Wheat” compared to the Silent Generation (7%)
Bagel Findings - Among respondents who consume “Bagels” N=200:
• 65% of respondents cite “Taste” as the most important attribute driving Bagel purchase intent
• More than half (55%) of respondents prefer eating an “Open-Faced Bagel” sandwich compared to shy of half (45%) who eat it “Closed”
• “Plain” is the number one flavor consumed by all generations with half of all respondents citing it
• “Cinnamon Raisin” (43%) is the second most popular flavor consumed among all generations
• “Blueberry” is a well-liked flavor consumed by more than a third (37%) of respondents
• More than a quarter of respondents consume "Everything” (28%) while a quarter consume “Onion” (25%)
• “Honey Wheat” (14%) and “Egg” (14%) are equally consumed
• Shy of a quarter of respondents consume “Multigrain” (22%), “Seeded” (21%) and “Whole Wheat” (19%) flavors
• 8% of respondents consume “Maple French Toast”; among all generations, Gen Y are the heaviest consumers (17%)
Pita Findings - Among respondents who consume “Pitas” N=200:
• “Taste” is the number one driver of Pita purchases with 55% of respondents citing it as the most important attribute
• Shy of two-thirds (65%) of respondents consume “Plain” making it the number one flavor among all generations
• “Whole Wheat” (63%) is the second most popular flavor consumed by all respondents with more than half citing it
• “Multigrain” (59%) is well-liked by all generations
• More than a third (36%) of respondents consume “Flax, Oat Bran & Whole Wheat”
• More than a quarter (29%) of all respondents consume “Ancient Grains”; among all generations, Gen Y (36%) are the heaviest consumers of “Ancient Grains “compared to Gen Z (13%)
Wrap/Flatbread Findings - Among respondents who consume “Wraps/Flatbreads” N=200:
• “Taste” is the number one driver of Wrap/ Flatbread purchases with more than half (52%) of respondents citing it as the most important attribute
• “Whole Wheat” is the most popular flavor consumed by all generations with shy of half (49%) citing it
• “White” (46%) is the second most popular flavor consumed by all respondents
• More than a third of respondents consume “Multigrain” (39%)
• More than a quarter (26%) of respondents consume “Grains”
• Shy of a quarter (24%) of respondents consume “Garlic” while the younger generations are the heaviest users with more than a quarter citing it
• 18% of respondents consume “Spinach”; among all generations, Gen X (27%) and Gen Y (21%) prefer “Spinach” flavors compared to Baby Boomers (13%) and Gen Z (13%) while the Silent Generation does not consume
Generations defined: Gen Z born 1996 and later; Gen Y born 1977 to 1995; Gen X born 1965 to 1976; Baby Boomers born 1946 to 1964; Silent Generation born 1925 to 1945
For more information, visit www.ComaxFlavors.com.
Looking for a reprint of this article?
From high-res PDFs to custom plaques, order your copy today!

