Comax Flavors: Crackers and Snacking
Comax Flavors studies consumers’ cracker eating habits, attitudes
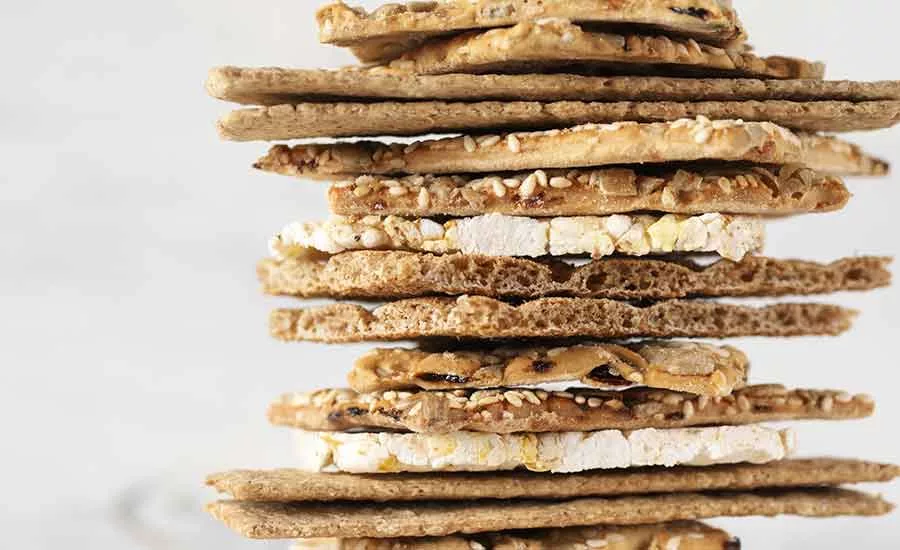
Comax Flavors released new primary research on consumers’ behavior, usage and attitudes towards cracker products. Specifically, the research covers crackers, crisp/thin crackers, flatbread crackers and pita crackers/chips.
This is the ninth study of the company’s primary market research program. The Cracker study was fielded in October 2017 with 1,000 U.S. respondents aged 18-70+; half were female and the other half were male.
According to Mintel, close to two-thirds of consumers see crackers as an easy and healthy snack with 92% of American households purchasing crackers.
“We’ve seen quite a bit of market activity in crisp/thin crackers as well as some interesting flavor profiles in the general cracker segment,” says Catherine Armstrong, Comax vice president of corporate communications. “We wanted to better understand consumers’ behaviors towards crackers and how they are changing.”
Comax partnered with Amy Marks-McGee of Trendincite LLC to manage the market research program; and Costello Creative Group to translate the data into creative, fun and easy-to-read infographics.
Additional Comax studies include those covering spirits as well as tea.
Below are just a few of the study highlights. To request a copy of the complete, “How Crackers Stack Up” infographic, contact carmstrong@comaxflavors.com.
Cracker Findings - Among respondents who consume “Crackers” N=250:
• Two-thirds of respondents consume Crackers as a snack
• “Taste” is the most important attribute driving Cracker purchases with shy of three quarters (72%) of respondents citing it
• Two-thirds (66%) of respondents consume “Plain/Original” making it the number one flavor among all generations
• 30% of respondents consume “Cheese”; among all generations, a third or more of Gen Y (38%), Gen Z (38%) and the Silent Generation (34%) consume “Cheese” while more than a quarter of Gen X (26%) and Baby Boomers (26%) consume it
• Just less than one-quarter (24%) of respondents consume “Whole Wheat”
• 15% of respondents consume “Sea Salt”
• “Butter” (22%) and “Garlic” (21%) are almost equally consumed
• 11% of respondents consume “Grains”; among all generations, the Silent Generation (18%) prefers “Grains” compared to Gen X (5%)
• “Herbs” (11%) and “Ranch” (11%) are equally consumed
• 10% of respondents consume “Spicy”; among all generations, Gen Y consumers (23%) are the heaviest users compared to the Silent Generation (2%)
• 10% of respondents consume “Savory”; among all generations, Gen X (18%) and Gen Y (14%) are the heaviest consumers of “Savory” flavors
• 10% of respondents consume “Onion”; among all generations, it is preferred by Gen Z (14%) and the Silent Generation (12%) compared to Baby Boomers (9%), Gen Y (8%) and Gen X (8%)
Crisp/Thin Cracker Findings - Among respondents who consume “Crisp/Thin Crackers” N=250:
• Shy of three quarters (72%) of respondents consume Crisp/Thin Crackers as a snack
• “Taste” is the most important attribute driving Crisp/Thin Cracker purchases with shy of three quarters (71%) of respondents citing it
• “Plain/Original” is the most popular flavor among all generations with shy of two-thirds (65%) of respondents citing it
• More than a third of respondents consume “Cheese Combos” (37%)
• 37% of respondents consume “Herbs”; among all generations, Gen X (59%) are the heaviest consumers followed by Baby Boomers (39%)
• 36% of respondents consume “Grains”; among all generations, shy of a third or more of Gen Z (39%), Baby Boomers (38%), Gen X (38%) and Gen Y (33%) consume “Grains” compared to a little more than a quarter of the Silent Generation (28%)
• More than a quarter (27%) of respondents consume “Salt Combos”
• “Vegetable” (15%) and “Seeds” (15%) are equally consumed
• “Whole Wheat & Honey” is consumed by less than a quarter (20%) of respondents; among all generations, “Whole Wheat & Honey” is preferred by Gen Y (33%) and Gen Z (29%) compared to the Silent Generation (7%)
• Only 6% of respondents consume “Fruit”; among all generations, the Silent Generation does not consume “Fruit” while Gen Y (19%) are the heaviest consumers
Flatbread Cracker Findings - Among respondents who consume “Flatbread Crackers” N=250:
• 70% of respondents consume Flatbread Crackers as a snack
• 61% of respondents cite “Taste” as the most important attribute driving Flatbread Cracker purchase intent
• “Plain/Original” is the number one flavor consumed by all generations with shy of half (49%) of all respondents citing it
• “Whole Grain” (46%) is the second most popular flavor consumed by all generations
• 43% of respondents consume “Sea Salt & Olive Oil”; among all generations, more than half (57%) of the Silent Generation consume this flavor compared to a third of all the other generations
• “Tomato, Basil & Mozzarella” (41%) and “Italian Herb” (41%) are equally consumed
• “Sesame” (34%) is consumed by one-third of respondents and is well-liked by all generations
• More than a quarter of respondents consume “Onion” (28%) and “Rosemary & Sea Salt” (26%)
• 22% of respondents consume “Everything”; among all generations, Gen Y (27%) are the heaviest consumers of “Everything” compared to the Silent Generation (7%)
• 21% of respondents consume “Sourdough”; among all generations, shy of a quarter of Gen Y (24%), Baby Boomers (24%) and Gen X (22%) consume “Sourdough” compared to Gen Z (24%) and the Silent Generation (7%)
• 18% of respondents consume “Spinach, Artichoke & Feta”; among all generations, the Silent Generation does not consume this flavor
Pita Cracker/Chip Findings - Among respondents who consume “Pita Crackers/Chips” N=250:
• Shy of two thirds (63%) of respondents consume Pita Crackers/Chips as a snack
• “Taste” is the number one driver of Pita Cracker/Chip purchases with more than half (58%) of respondents citing it as the most important attribute
• “Original/Naked” (52%) and “Parmesan “Cheese & Basil” (52%) are the top two flavors equally consumed and well-liked by all generations
• “Sea Salt is a popular flavor consumed by half (51%) of all respondents while shy of half (46%) of respondents consume “Herb”
• 40% of respondents consume “Rosemary & Garlic”; a third or more of all generations except the Silent Generation like “Rosemary & Garlic”
• More than a third (36%) of respondents consume “Five Cheese” while shy of a third (31%) consume “Flax, Oat, Bran & Whole Wheat”
• A quarter (25%) of respondents consume “Cinnamon Sugar” while shy of a quarter (24%) consume “Black Olive & Feta”
Generations defined: Gen Z born 1996 and later; Gen Y born 1977 to 1995; Gen X born 1965 to 1976; Baby Boomers born 1946 to 1964; Silent Generation born 1925 to 1945
For more information, visit www.ComaxFlavors.com.
Looking for a reprint of this article?
From high-res PDFs to custom plaques, order your copy today!

