Ingredient Challenges: Teasing Out Texture Testing

Consumers generally evaluate a food by using a combination of senses, including sight, smell, taste, touch and, in some cases, even sound. The crunch of bread crust, for instance, affects the senses of sound as well as touch (mouthfeel). Batter coatings on fish, meat and poultry have appeal through the sense of taste, as well as the mouthfeel of the coating thickness. All of these sensory inputs cause subjective evaluations that vary from person to person. This complicates the application of sensory evaluation in quality control during the manufacture of a food product.
Traditionally, monitoring the quality of finished products was the responsibility of chefs in restaurants, or of quality control personnel who used qualitative sensory methods in food plants. However, taking advantage of advances in technology, various analytical tools can be applied in order to quantify sensory perceptions into more objective characteristics. No single tool can be used to quantify all sensory parameters, so one must look for a particular tool to characterize each sensory property.
For example, a texture analyzer can be used to characterize physical properties that are responsible for determining the “feel” of a product. Historically, texture analyzers were expensive tools, and this factor was largely responsible for keeping them out of reach of all but the largest food processors and researchers. Now, the market is more competitive and prices are falling within range of even small food producers. In this article, bread is used to demonstrate how one might apply this analysis; however, similar tests may apply to any flour-based bakery product.
The Mechanics of Testing
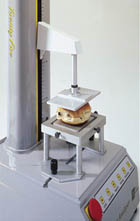
Physical testing of bread products typically involves a method termed Texture Profile Analysis (TPA). TPA is a test whereby a prepared bread sample undergoes a two-cycle compression test using a large, flat-surfaced, cylindrical probe which compresses the bread sample to a fraction of its thickness. (See chart “Calculated Parameters.”) During the entire test, the response (i.e., resistance to being compressed) of the bread is monitored via a load cell between the probe and the texture analyzer. The large degree of deformation of the bread generally results in some internal damage from which the bread fails to recover. The first compression stroke “destroys” some of the structure of the sample. The test probe returns to its original start position, and then performs a second compression cycle to the same point, while sensing the loss of thickness of the sample. This results in a very different textural profile during the second cycle, in which the compressed bread is compared to the first trial. From these results, textural characteristics can be identified.Relevant physical parameters of the bread sample can objectively be determined by analyzing the load profile data by the terms first used in the 1960s and 1970s.
To adopt texture profile analysis as a quality control tool, some agreed-upon “good” samples and “bad” samples first must be obtained. TPA test data is then collected on each sample, and numerical limits for each parameter are established. These help testers to objectively distinguish good samples from bad samples.
Some test considerations for a meaningful TPA are as follows:
Controlling Viscosity and Costs
A typical batter is a mixture of flour, eggs, milk, seasonings and other additives such as cornstarch. Variations may include egg substitutes and water-based liquids in place of the milk. Batters will have a broad range of consistencies or thickness, depending upon the ratio of liquids to solids. Measuring product viscosity is one way to characterize this property, to ensure repeatability between batches of a specific batter formulation. A complex process, product viscosity is not a single value, but the result of a family of values, depending upon test conditions when making the measurements (using a rotational viscometer). A brief explanation will clarify how this is done.Most materials, batters included, will exhibit pseudoplastic behavior when tested with a rotational viscometer. This simply means that a rotating spindle immersed in the batter will experience lower viscous drag at a high speed compared to a low speed. This drop in viscosity is referred to as the degree of pseudoplastic behavior. (See chart “Thinning with Shear.”) Thin batters will show relatively minor changes in viscosity while thick batters can be highly pseudoplastic.
The ability to characterize the pseudoplastic behavior of the batter can pay dividends in more ways than one. Processing the batter effectively in a production operation relates back to the viscosity issue. Thicker formulations are more difficult to move and handle in general; there also is a correlation between the thickness of the batter coating on a food item and the viscosity of the batter. Consequently, some food preparers have progressed from making benchtop measurements with a rotational viscometer in the QC lab to using an on-line process viscometer which measures continuously as the batter is mixed and applied. The obvious advantage to the food manufacturer is the improved quality in consistency of coating thickness, as well as the cost savings of controlled batter consumption.
This article has been a very quick introduction to the world of texture analysis and viscosity measurement. Breads and batters are good examples of food items that warrant measurement for obvious quality and business reasons. Manufacturers who have detected variable results in their production operations may gain an advantage by investigating these issues.
Links
Looking for a reprint of this article?
From high-res PDFs to custom plaques, order your copy today!

