Restaurant Performance Index Declined in September
Same-store sales and customer traffic results were mixed; Restaurant operators remain unimpressed by the economy
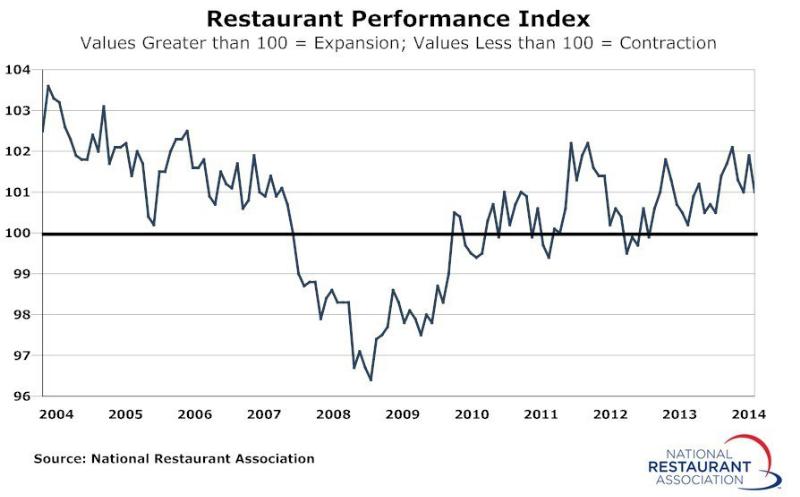
As a result of softer customer traffic levels and a somewhat dampened outlook among restaurant operators, the National Restaurant Association's Restaurant Performance Index (RPI) registered a moderate decline in September. The RPI – a monthly composite index that tracks the health of and outlook for the U.S. restaurant industry – stood at 101.0 in September, down 0.9 percent from its August level. Despite the decline, the RPI remained above 100 for the 19th consecutive month, which signifies expansion in the index of key industry indicators.
|
|
"The September decline in the RPI was due in large part to a dampened outlook among restaurant operators for business conditions in the months ahead," said Hudson Riehle, Senior Vice President of the Research and Knowledge Group for the National Restaurant Association.
"Restaurant operators remain unimpressed about the direction of the economy, with elevated food costs remaining at the top of their list of challenges."
The RPI is constructed so that the health of the restaurant industry is measured in relation to a steady-state level of 100. Index values above 100 indicate that key industry indicators are in a period of expansion, while index values below 100 represent a period of contraction for key industry indicators. The Index consists of two components – the Current Situation Index and the Expectations Index.
The Current Situation Index, which measures current trends in four industry indicators (same-store sales, traffic, labor and capital expenditures), stood at 101.0 in September – down 0.8 percent from August. Despite the drop, the Current Situation Index remained above 100 for the seventh consecutive month, which signifies expansion in the current situation indicators.
A majority of restaurant operators reported higher same-store sales for the seventh consecutive month. Sixty-three percent of restaurant operators reported a same-store sales gain between September 2013 and September 2014, essentially unchanged from 62 percent who reported higher sales in August. Meanwhile, only 23 percent of operators reported a same-store sales decline in September, up slightly from 21 percent in August.
In contrast, restaurant operators reported somewhat softer customer traffic results in September. Forty percent of restaurant operators reported an increase in customer traffic between September 2013 and September 2014, while 33 percent reported lower customer traffic. In August, 45 percent reported higher customer traffic, while 31 percent reported a decline. With sales and traffic results coming in mixed in September, restaurant operators reported somewhat dampened capital spending activity. Forty-nine percent of operators said they made a capital expenditure for equipment, expansion or remodeling during the last three months, down from 59 percent who reported similarly last month.
The Expectations Index, which measures restaurant operators' six-month outlook for four industry indicators (same-store sales, employees, capital expenditures and business conditions), stood at 100.9 in September – down 1.1 percent from August and the lowest level in 11 months. Despite the decline, September represented the 23rd consecutive month in which the Expectations Index stood above 100, which indicates restaurant operators remain generally optimistic about business conditions in the months ahead.
Restaurant operators remain generally positive about sales gains in the coming months. Forty percent of restaurant operators expect to have higher sales in six months (compared to the same period in the previous year), down slightly from 45 percent who reported similarly last month. Meanwhile, eight percent of restaurant operators expect their sales volume in six months to be lower than it was during the same period in the previous year, up from five percent last month.
While restaurant operators are relatively optimistic about sales growth, their outlook for the economy remains mixed. Twenty percent of restaurant operators said they expect economic conditions to improve in six months, while 19 percent expect the economy to worsen. The remaining 61 percent expect economic conditions in six months to be about the same as they are now.
For the 13th consecutive month, a majority of restaurant operators said they are planning for capital expenditures in the months ahead. Fifty-three percent of restaurant operators plan to make a capital expenditure for equipment, expansion or remodeling in the next six months, down from 59 percent who reported similarly last month.
The RPI is based on the responses to the National Restaurant Association's Restaurant Industry Tracking Survey, which is fielded monthly among restaurant operators nationwide on a variety of indicators including sales, traffic, labor and capital expenditures. The full report and video summary are available online at Restaurant.org/RPI.
Looking for a reprint of this article?
From high-res PDFs to custom plaques, order your copy today!

